According to Anthony Vidler, the word “diagram” can be traced from the Old French word “diagramme”, which in turn comes from the Greek “diagramma” [the prefix “dia-” meaning “through” and “across” and the suffix “graphein”], which means “something written, like a letter of the alphabet”[01] . Vidler asserts that “a diagram might be ‘a figure composed by lines’, an ‘illustrative figure’, a ‘set of lines, marks, or tracings’. But it is the function of these traces that is important: the diagram serves something else. It illustrates a definition, aids in the proof of a proposition, it represents the course or results of any action or process” [02]. It is exactly this characteristic of “procession” which leads to the generation of congruence, a characteristic that has evolved and changed nowadays, together with the manner of documenting intricate processes of form-finding and fabricating. More specifically, Robert E. Somol has stated that the diagramming discourse is nowadays confused, which is due to “its near-universal use and abuse, its simultaneous promotion and denigration” [03].
This novel aspect of diagramming is exactly what Lars Spuybroek refers to when he is describing his “flexible interacting system” [06] method of work. When analysing the nature of the diagramming process that is currently in use, he states that there are different names for each case, such as “flexigrams, haptograms, kinetograms, even awarograms. ‘Flexible’ because they are not rigid, they don’t know just one solution, ‘interactive’ because all are connected into one system: one parameter changes everything” [07]. The creation of the aforementioned diagrams always takes place in a digital environment, in a “virtual whole” [08] machine. This machine is not an abstract one, but a “geometric system where all relations are set but not fixed, and then all the information is processed over time” [09]. This diagrammatic system of interactivity and flexibility mentioned by Spuybroek appears to be related to Sanford Kwinter’s definition, where “the diagram is an invisible matrix, a set of instructions” [10], which is the organizational basis for “the expression of features in any material construct”[11].Furthermore, Kwinter states that “the diagram is the reservoir of potential that lies at once active and stored within an object or an environment [or in every aggregate or section of these]” [12]. This “matrix”- operation characteristic of contemporary diagramming techniques is also found in the digital design software tools that are mostly used nowadays, as opposed to the “old-school” methods of designing and tooling.
This catalytic function that brings forth and sustains the digirammatic procedure in the digital domain is very similar to the Deleuzian description of the diagram as a “battle that occurs in the canvas between the painter and his data” [17].It is through the painting techniques of Francis Bacon that Gilles Deleuze explains the notion of the diagram:
“What is this act of painting? Bacon defines it as follows: making marks at random (brushstrokes-lines); cleaning, sweeping, or wiping places or areas (daubs-color); throwing paint at varied angles and speeds. Now this act (or acts) presupposes that there are already figurative data on the canvas (and also within the painters head) that are more or less virtual or more or less actual. These data will be precisely demarcated, cleaned, swept, and wiped, or covered over, by the act of painting. For example, we lengthen a mouth, we make it go from one side of the head to the other; we clean part of a head with a brush, a scrubbing brush, a sweeping brush, or a rag. This is what Bacon calls a Diagram…”[18].
Thus, just like in painting the “figurative data” is organized by the “act” – i.e. the diagram – the commensurate architectural equivalent would be that of the digigram organizing digital data, in order to create form. In this case, the “marks at random [brushstrokes-lines]” could correspond to a number of particles and particle curves and the throwing of paint “at varied angles and speeds” could very well be substituted by particle emitters in fields, performing at different values of speed, attenuation and magnitude. Only after this digital data becomes controlled and ordered can it be transformed into architectural form – through the “battle that occurs” in the digital platform. Gilles Deleuze asserts that the real function of this “battle” is the introduction of the “possibilities of fact” that set the rules for the “emergence of another world” [19].
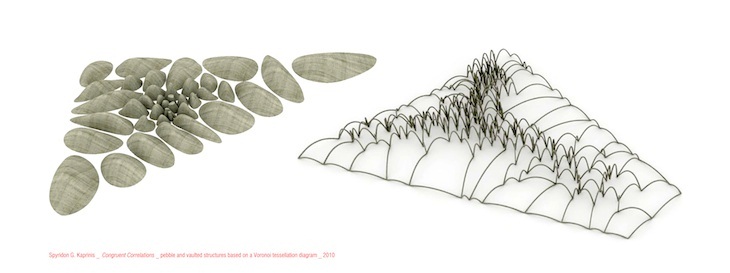
As far as “battle” techniques are concerned, the “Kata” is an example of a rigorous and precise set of Japanese karate fighting “tools” – similar to the “set of instructions”. Apart from their fighting aspect, katas can also be used as a form of gymnastics and philosophy. Each kata – when combined and synchronized with other katas – can lead to the build-up of a complete and accurate engaging and fighting “machine”[20]. The inherit code within this process of the unraveling of physical force is not intuitive, nor abstract: it is an articulate, detailed and calculative process that is – mutatis mutandis – commensurate to the diagramming via, for example, the “blend-shape” snapshot technique used in parametric design software and scripting applications, such as Autodesk Maya and Maya Embedded Language [MEL]or Rhinoceros and Grasshopper graphical algorithm editor, where the initial form becomes deformed – though topologically never altered – in a certain process. And it is only by a catalytic combination of the blend-shape digigrams that the final formal outcome can be extracted and “coaxed out”, as the following sequential images and digigrams reveal.
The aforementioned ”blend-shapes” are defined as hybrid and congruent objects, whose form -according to Kostas Terzidis- encloses the topology of the “source_object” and the geometry of the ”target_object” [21]. It is conceived as an intrinsic procedure of morphing, simulating the interstitial transitional steps from original_beginning to destination_end, which causes elastic topological transformational events [deformations] such as folding, stretching, twisting or scaling [homeomorphism], but never cutting or tearing [heteromorphism]. It concerns the dynamical theory of morphogenesis, “which characterizes all form as the irruption of a discontinuity, not on the system, but in it” [22] .
These action geometries[23], being integral parts of a digigram, act as snapshots of time and space, encompassing every formal transformation or “morphing” model and the non-linear interaction between objects and demonstrating, as Greg Lynn has observed, “the shift from a static to animate space” [24], based on the use of the computer. The diagrammatic characteristics of contemporary animation technology are time & motion, topology and parameters [25] that are further to be examined.
1. Vidler, Anthony, 2006, What is a Diagram anyway?, in Peter Eisenman: Feints, Milan: Skira, p.19-27.
2. Ibid., p.19.
3. Somol, Robert E., 1999, Dummy Text, or The Diagrammatic Basis of Contemporary Architecture, in Diagram Diaries, Peter Eisenman, London: Thames and Hudson, p. 06-25.
4. Ednie-Brown, Pia, 2000, The Texture of Diagrams: Reasonings on Greg Lynn and Francis Bacon, Daidalos, 74, p.72-79.
5. Kwinter, Sanford, 1998, The Hammer and the Song, OASE: On Diagram, 48, p.31-43.
6. Spuybroek, Lars, 2002, text from an interview by Cho Im Sik, Diagramming in Virtual Architecture + Digital Urbanism: The Cities of Everyday Life, Sarai Reader 2,New Delhi, p.243-248.
7. Ibid., p.243.
8. Ibid., p.244.
9. Ibid., p.244.
10. Kwinter, Sanford, 2006, “The Judo of Cold Combustion”, in Atlas of Novel Tectonics, Jesse Reiser and Nanako Umemoto, New York: Princeton Architectural Press, p.12-15.
11. Ibid., p.12.
12. Kwinter, Sanford, 2006, “The Judo of Cold Combustion”, in Atlas of Novel Tectonics, Jesse Reiser and Nanako Umemoto, New York: Princeton Architectural Press, p.12-15.
13. Somol, Robert E., 1999, “Dummy Text, or The Diagrammatic Basis of Contemporary Architecture”, in Diagram Diaries, Peter Eisenman, London:
Thames and Hudson, p.06-25.
14. Ibid., p.10.
15. Massumi, Brian, 1998, “Sensing the Virtual, Building the Insensible”, in Architectural Design: Hypersurface Architecture, London: Wiley-Academy, p.16-25.
16. Ibid., p.16.
17. Deleuze, Gilles, 1993, “The Diagram”, in The Deleuze Reader, edited by Constantin Boundas, New York: Columbia University Press, p.193-199.
18. Ibid., p.193.
19. Ibid., p.194.
20. Kanazawa, Hirokazu, 1981, Shotokan Karate International Kata [Vol.I], Tokyo: Shotokan Karate-Do International Federation, p.24-73.
21. Terzidis, Kostas, 2003, “Hybrid Form”, in Expressive Form: A Conceptual Approach to Computational Design, Kostas Terzidis, London: Spon Press, p.23-31.
22. Kwinter, Sanford, “Landscapes of Change: Boccioni’s Stati d’animo as a General Theory of Models”, Assemblage 19, p.52-65.
23. Lynn, Greg, “Geometry in time”, in Anyhow, ed. Cynthia Davidson, New York: Anyone Corporation, p.170.
24. Ibid., p.165.
25. Ibid., p.171.
26. Ibid., p.171.
 THE CONGRUENCE OF DIA-/DIGI-GRAMMING
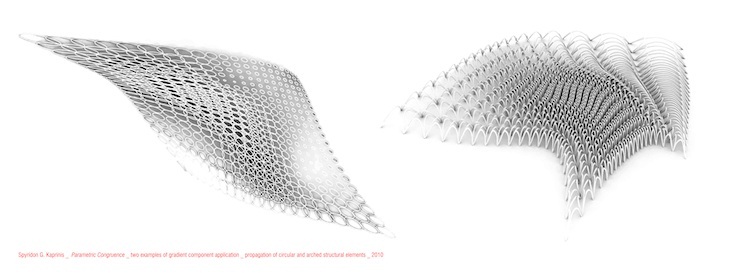 THE CONGRUENCE OF DIA-/DIGI-GRAMMING